
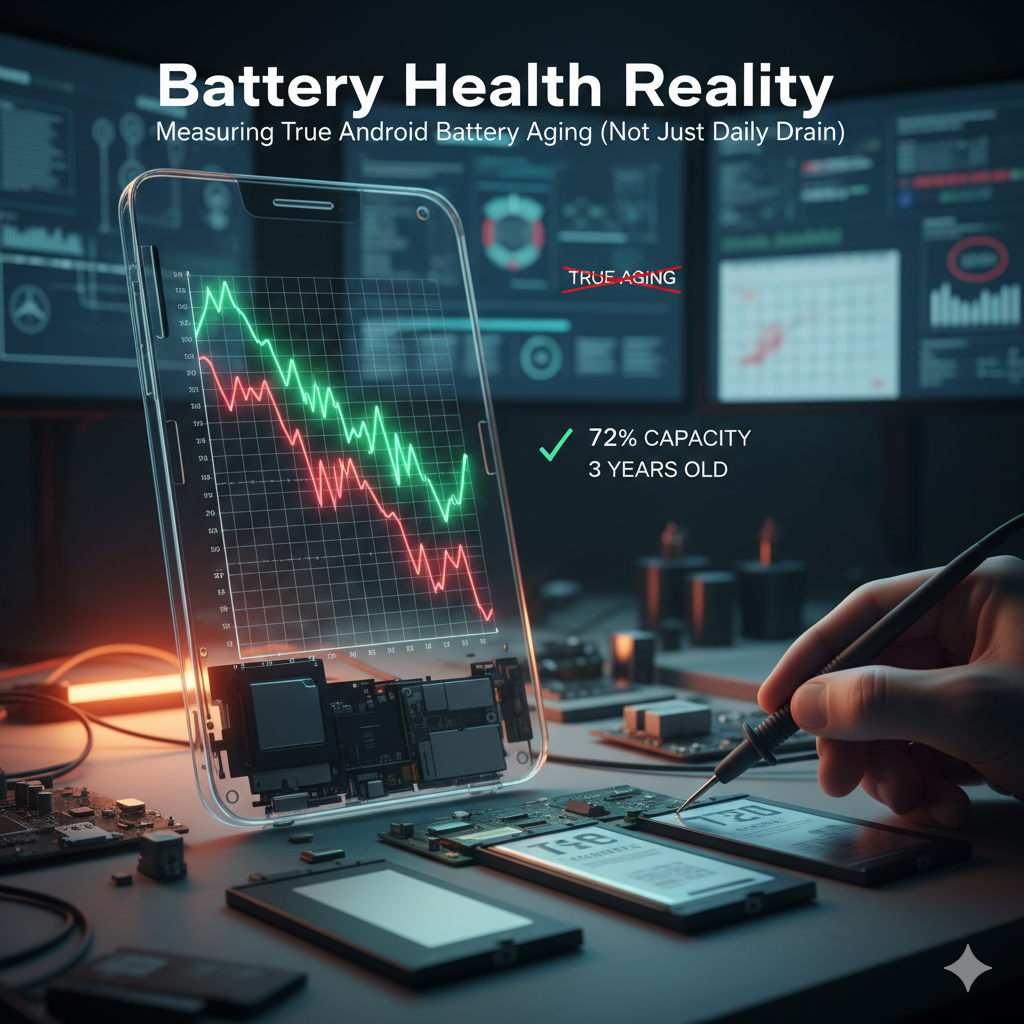
Evidence-based pillar guiding Android users to distinguish runtime drain from real battery capacity loss, measure effective capacity without root, and apply habits that slow degradation.
You’re charging more often than last year and seeing contradictory advice: “Never fast charge,” “Drain to 0% monthly,” “Use only original chargers,” “Don’t charge overnight.” Most of it blurs two different things:
1. Understanding Lithium-Ion Degradation (Plain Language)
Lithium-ion battery aging is cumulative chemistry change inside each cell. Over time:
- SEI (Solid Electrolyte Interphase) layer thickens on the anode → reduces usable lithium.
- High temperatures accelerate SEI growth & side reactions.
- Extreme voltage ranges (prolonged high states near 100%, deep discharges near 0%) add stress.
- Full cycles accumulate: A “cycle” is aggregate of partial discharges adding to 100%. Two 50% drops = one full cycle.
Think of capacity as a backpack that gradually shrinks internally. Daily drain empties the backpack; degradation reduces its total internal volume permanently.
Variables accelerating degradation:
- Heat (especially >35–40°C while charging or gaming)
- High current charging (fast charging + poor ventilation)
- Deep discharge frequency (regular dips to near 0%)
- Time (calendar aging even if unused—slower than cycle aging)
2. Runtime Drain vs Capacity Loss
| Aspect | Runtime Drain | Capacity Loss |
|---|---|---|
| Cause | Active apps, screen brightness, radios, background sync | Chemical aging (cycles, heat, voltage extremes) |
| Timeframe | Immediate / daily | Long-term (months/years) |
| Reversible? | Yes (optimize usage, debloat, manage sync) | No (can only slow future loss) |
| Symptoms | Rapid % drop today, warm device during tasks | Shorter total hours per full charge consistently across weeks |
| Fix Approach | Performance + battery drain diagnostics | Habit improvements or battery replacement |
Common confusion: A single hot gaming session = big drain; users think “battery ruined,” but one session doesn’t suddenly remove 10% capacity. Degradation is slower; heat spikes repeated daily accelerate it.
Internal link placeholders:
- (Link: Diagnose Battery Drain)
- (Link: Performance Blueprint)
3. Expected Lifespan Benchmarks (Cycles & % Loss)
Typical consumer Li-ion phone battery patterns under moderate conditions:
| Benchmark | Light Use (No heavy gaming) | Mixed Use (Average user) | Heavy Use (Gaming / high brightness) |
|---|---|---|---|
| ~1 Year | 95–90% of design capacity | 92–88% | 88–82% |
| ~2 Years | 90–85% | 85–80% | 80–72% |
| ~3 Years | 85–78% | 78–70% | 70–60% (replacement strongly considered) |
Notes:
- Variability: OEM battery quality, thermal envelope, charging profile.
- “500 cycles” guideline: Many phone packs remain ~80%+ after ~500 full equivalent cycles if heat managed.
- Calendar aging alone (device rarely used) still reduces capacity a few percent yearly.
Avoid absolute statements; treat ranges as typical envelopes.
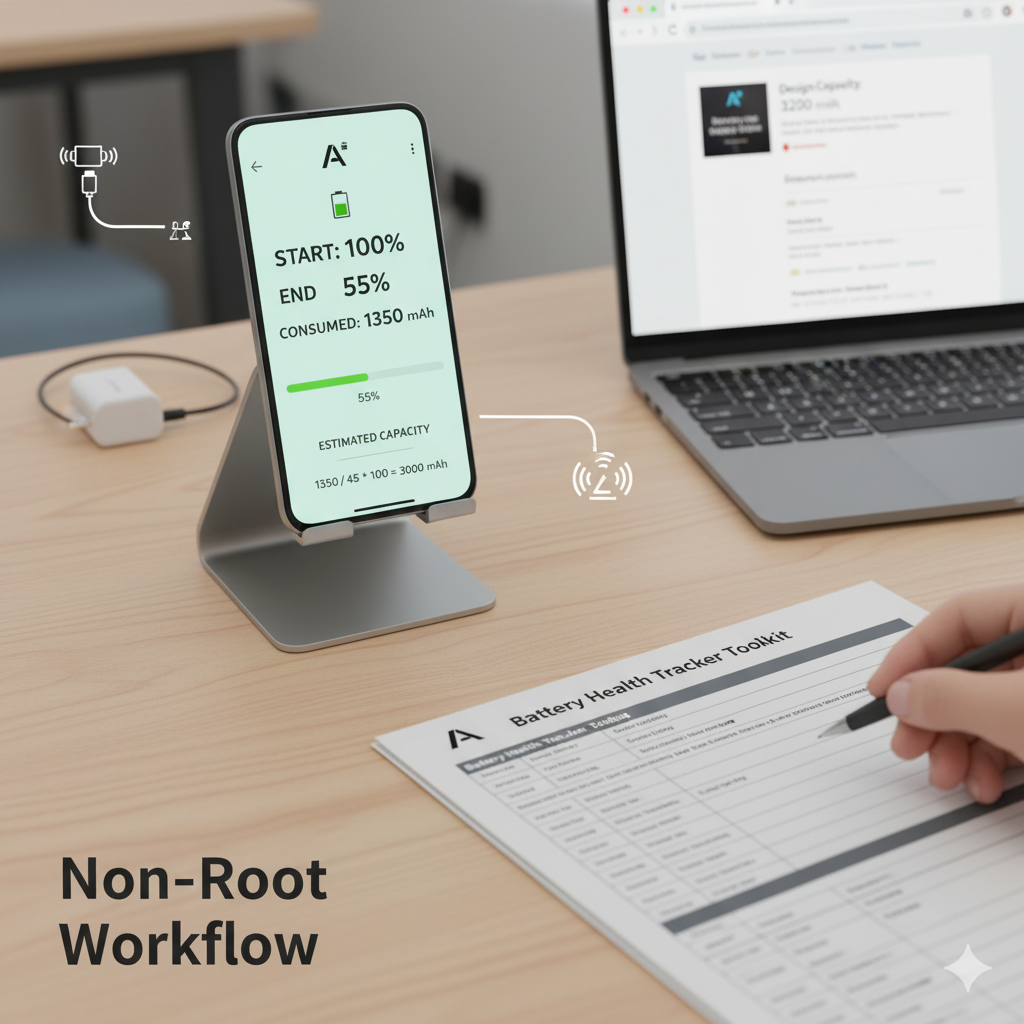
4. Measuring Your Effective Capacity (Non-Root Workflow)
You cannot read “true” design capacity directly from all devices without root or manufacturer tools. Instead, approximate effective capacity using consumption vs percentage drop.
Tools Needed
- A battery logging app (e.g., AccuBattery) OR manual logging.
- (Optional) Battery Health Tracker Toolkit (Download CTA mid-article).
- Stable usage sessions (avoid OS update days).
Protocol (Repeat 3–5 Times for Averaging)
- Charge to 100%. Unplug. Allow phone to cool (no heavy tasks for 5–10 min).
- Begin a normal mixed-use session. Avoid simultaneous extreme heat (gaming + sun).
- Use the device down to ~50–40% (a large but not full drop).
- Record:
- Start % (100)
- End % (e.g., 55%)
- Reported mAh consumed (from logging app) OR approximate via:
If app shows “Estimated capacity” / partial consumption log.
- Estimate effective capacity:
Formula:
Estimated Capacity (mAh) = (Consumed mAh ÷ %Drop) × 100
Example: Consumed 1,350 mAh from 100%→55% (45% drop) → 1,350 / 45 × 100 ≈ 3,000 mAh. - Compare design capacity (search spec sheet for your model or packaging).
- Repeat different day/time; discard anomalous run (e.g., heavy camera use + thermal throttling).
Validate Consistency
- If runs vary more than ±6%, log a 4th or 5th session.
- Outlier reasons: background sync surge, high ambient heat, partial recharge mid-session.
Logging Template (Plain Text)
Date | Start% | End% | %Drop | Consumed mAh | Est. Capacity | Temp Notes (Cool/Warm/Hot) | Activity Tags
2025-11-03 | 100 | 55 | 45 | 1350 | 3000 | Warm (gaming 20m) | Mixed / Chat / Video
2025-11-04 | 100 | 52 | 48 | 1450 | 3020 | Cool | Mixed / Reading
Average Estimated Capacity: (3000 + 3020) / 2 ≈ 3010 mAh.
If design capacity: 3200 mAh → Health ≈ 94%.
Caveats
- Single run ≠ definitive. Use average.
- Logging apps estimate mAh via charge/discharge current sampling; initial values settle after a few cycles.
- Don’t panic over day-to-day runtime variation—focus on capacity trend.
(CTA) Ready to log systematically? Download the Battery Health Tracker Toolkit to automate calculations and habit scoring.
5. Thermal Effects: Heat as the Silent Multiplier
Heat accelerates chemical side reactions and SEI thickening. Main sources:
- Gaming + charging simultaneously
- Fast charging in confined space (under pillow, car vent blowing hot air)
- Prolonged bright sun use (navigation on dash)
- High ambient climates + thick insulating case
Mitigation:
- Separate charging and heavy gaming sessions.
- Remove bulky case for fast charge bursts.
- Avoid leaving device in parked car heat.
- Monitor if device frequently “warm idle” (point to background tasks or poor ventilation).
Rule of thumb: Reducing average charging temperature events dramatically slows long-term capacity loss more than micro-optimizing charge percentages alone.
6. Charging Habits: High-Impact vs Low-Impact
| Habit | Impact Level | Recommended Action | Why |
|---|---|---|---|
| Avoid sustained 100% + heat | High | Unplug after full when device remains warm | High voltage + heat synergy accelerates aging |
| Limit deep 0–5% discharges | High | Recharge around 15–25% when practical | Deep depletion stresses chemistry |
| Reduce gaming while charging | High | Charge before or after sessions | Less thermal stacking |
| Partial cycles (20–80%) when convenient | Medium | Not mandatory, but helpful | Reduces time at extremes |
| Use OEM or certified chargers | Medium | Ensure spec compliance | Stable current & thermal control |
| Occasionally fast charge only when needed | Medium | Everyday if moderate temps okay | Modern BMS mitigates risk; heat is driver |
| Overnight charging in cool conditions | Low | Acceptable if not heat-trapped | BMS reduces top-off stress |
| “Battery calibration” rituals monthly | Low (Myth) | Not needed routinely | Doesn’t restore capacity |
| Closing background apps obsessively | Low | Focus on actual drain outliers | Kill loops waste time |
Focus first on heat-related factors + extreme voltage time reduction; ignore ritualistic full discharges.
7. Fast Charging & High Watt Trade-Offs
Fast charging phases:
- Constant current (CC) ramp: rapid energy input.
- Constant voltage (CV) taper near 80–100%.
Concerns: More current = more heat. Modern systems (USB PD, vendor algorithms) throttle to defend temperature.
Practical Approach:
- Use fast charge when time constrained.
- Prefer slower or moderate wattage overnight if device tends to warm.
- If battery health already declining quickly, pilot a week reducing fast charge usage; observe thermal logs.
Myth: “Any fast charge kills battery quickly.”
Reality: Heat management is key; controlled fast charge at safe temperatures has moderate impact; repeated high-temp sessions amplify aging.
8. Overnight Charging Realities
Leaving phone at 100% overnight is less harmful than:
- 100% + trapped heat (under blanket)
- 100% + constant background wake (unstable network)
Mitigations:
- Place device on ventilated surface.
- Optional smart plug timer: Begin charging later so it completes near wake time.
- If using optimized charging feature (OEM “Adaptive Charging”), keep it enabled—it reduces time at full voltage.
You do NOT need to wake at 3 AM to unplug manually.
9. Calibration Myth Busting
Myth: “Draining to 0% then charging to 100% monthly recalibrates battery health.”
Reality:
- It recalibrates software estimation if gauge drifted (rare).
- Does not restore lost chemical capacity.
- Use full cycle only if percentage readings behave erratically (jumping from 15% to 1%).
Routine deep cycles impose extra stress; avoid making them a habit.
10. Decision Thresholds: Optimize, Replace, Upgrade
Textual Flow:
Experiencing mid-day forced recharges?
│
├─ Measure effective capacity (Protocol Section 4)
│
├─ Capacity ≥80%?
│   ├─ YES: Focus on runtime causes (background drain, heat). (Link: Drain Guide)
│   └─ NO: Capacity 75–79%? Evaluate replacement if heavy usage & inconvenience high.
│
└─ Capacity <75%?
    ├─ Battery replacement if cost ≤30–40% of new device price
    └─ If other hardware outdated (camera/performance), weigh upgrade vs ecological impact
Scenarios:
- Gamer + 74% capacity + thermal spikes → Replacement improves both runtime & reduces heat events.
- Light user + 80% capacity + occasional drain complaints → Optimize usage; replacement premature.
11. Sustainability & Cost: Replace vs New Phone
Environmental angle:
- Manufacturing a new smartphone emits significantly more CO2 than producing a replacement battery.
- Extending device lifespan by 1–2 years reduces e-waste & resource extraction.
Cost lens:
- Battery replacement (official or reputable repair) often 20–35% of new midrange phone cost.
- Pair replacement with performance tweaks (debloat, storage cleanup) for a “renewal” effect.
Add internal link (future): Sustainable Android Usage Guide.
12. FAQ (Schema Candidates)
How many charge cycles does an Android phone battery last?
Most modern phone batteries retain ~80% capacity after roughly 500 full equivalent cycles under moderate heat. Heavy gaming or frequent high-temp fast charging can reach that threshold sooner.
Is fast charging bad for long-term battery health?
Fast charging alone is less harmful than sustained high heat. Modern battery management reduces risk; minimize gaming during charge and avoid insulating cases to limit thermal stress.
Should I avoid charging overnight?
Not necessarily. Overnight charging is fine in cool, ventilated conditions. The bigger issue is stacking heat (under blankets) or constant background wake cycles causing warmth.
Does draining to 0% help battery health?
Routine deep discharges stress cells and don’t restore capacity. Only perform a full cycle if your percentage readings behave erratically—otherwise keep to moderate ranges when convenient.
Is using a slower charger always better?
A slower charger may produce slightly less heat, but if your fast charger keeps temperatures moderate, the difference is minor. Heat management matters more than raw wattage.
Can apps “repair” battery health?
No app can restore lost chemical capacity. They can help monitor usage and estimate effective capacity; real aging is irreversible.
More tips here : https://www.honor.com/sa-en/blog/how-to-check-battery-health-in-android/
Also check out our adaptive battery settings https://androidfuze.com/adaptive-battery-on-android-what-it-actually-does-and-when-it-helps/